
As part of my Applied Econometrics course this semester, we have lab time each week where we’re working in Stata. As it’s been made clear to us, Stata still dominates all other statistical analysis packages in the field of Economics, and it carries distinct advantages–namely, it’s relative ease of use, along with its status as the lingua franca among Economists.
In spite of our classes, we’ve been told that we’re free to use whatever software we’d like for our assignments and thesis. I’ve been chewing on this topic for a couple of weeks now, as I’ve spent a lot of time over the past couple years trying to learn R.
With that said, I was excited to see this timely post, ‘Finding Economic Articles with Data’, from Sebastian Kranz on the R-bloggers mailing list the other week.
Because the AEA requires all authors to upload their data and replication code to go along with journal submissions, there’s a nice little repository of articles, data and code that goes back a little over a decade. Kranz has built a Shiny app that allows you to search the AEA data archives to see what data is available. Definitely have a look, it’s well done.
Overview of the database
Using the data provided in the blog post, I thought it would be fun to run the analysis myself to see if there is any additional insight we can mine from what’s been submitted to AEA.
Follow the link to download the database of economic articles used by Kranz’s Shiny app.
Here is a quick summary of the data of interest:
| n_articles | pct_w_code | yr_min | yr_max |
|---|---|---|---|
| 6786 | 0.505 | 2005 | 2019 |
The database provided contains information related to published articles submitted to different economic journals over a 15 year span, from 2005 until the present (March 2019 at the time of writing). Among those articles, 51% include code snippets, which we can use to analyze software package preferences.
Consult the app for a list of journal abbreviations covered in the database.
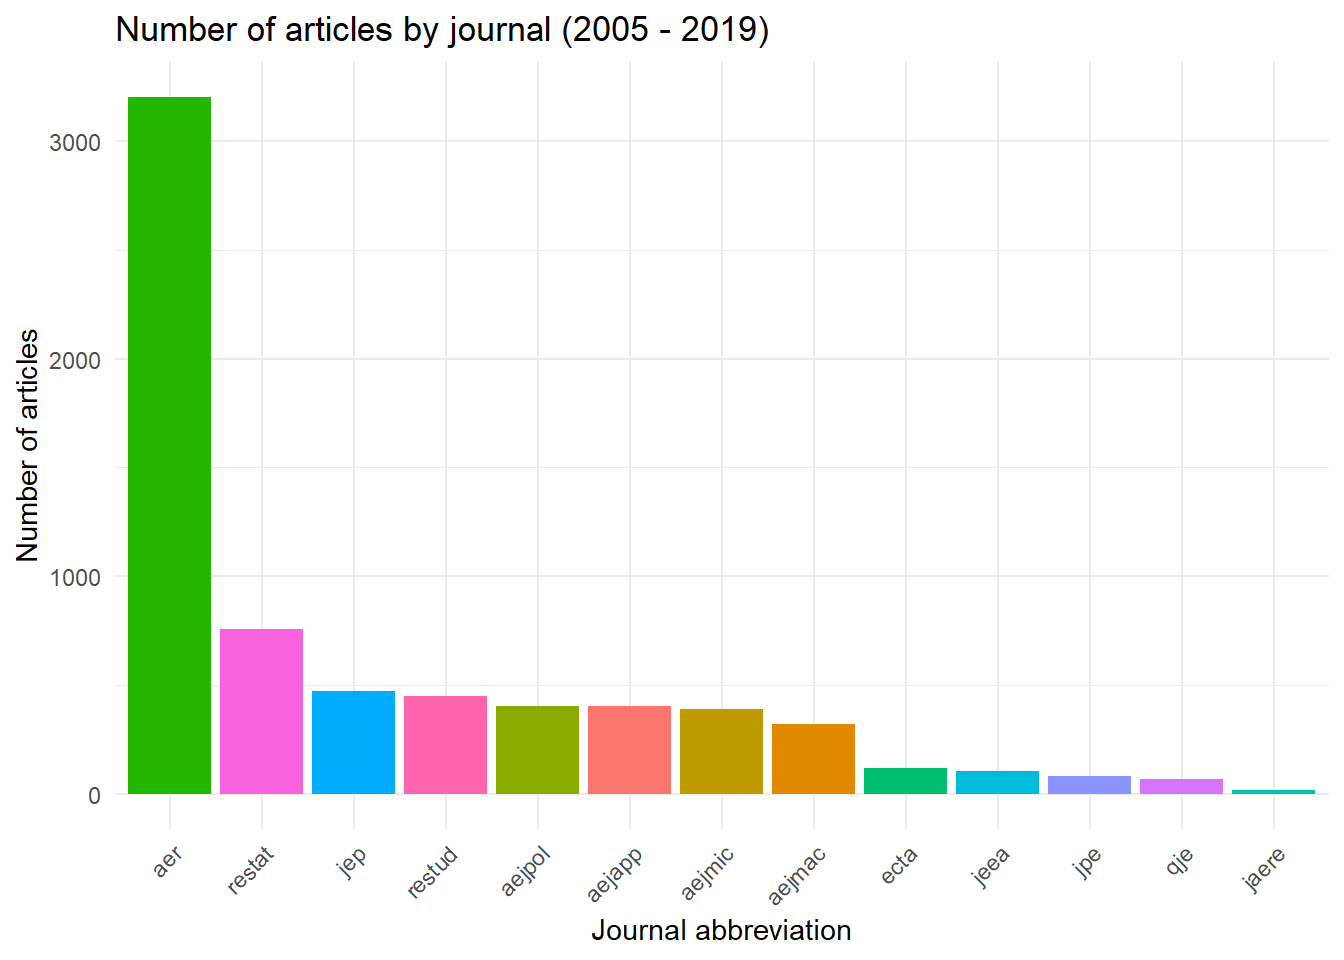
When we plot the number of submssions by journal, we can see that the American Economic Review contains the bulk of papers in this database at the present.
Software preferences
In the original Kranz blog post, he does a quick analysis to show what share of all code submitted to the various AER journals is written in what language. His results confirm that Stata does, in fact, dominate all other software (70% share, compared to 23% for Matlab and only 2.8% for R). After quickly peeking at the data, I can see that there are a few other popular languages in there that were not factored into his analysis, which I include here.
What is the most popular analytical package?
Using the file extension data from the included code snippets, we can easily match these to specific software packages to understand the relative popularity of each across all software used in journal submissions in the database.
Here’s what the top 15 results look like:
| file_type | count | share |
|---|---|---|
| do | 2741 | 59.44 |
| m | 947 | 20.54 |
| ado | 212 | 4.60 |
| sas | 174 | 3.77 |
| r | 123 | 2.67 |
| mod | 82 | 1.78 |
| prg | 60 | 1.30 |
| ztt | 49 | 1.06 |
| nb | 46 | 1.00 |
| c | 44 | 0.95 |
| py | 39 | 0.85 |
| cpp | 23 | 0.50 |
| f90 | 22 | 0.48 |
| g | 20 | 0.43 |
| java | 7 | 0.15 |
I’ve left all of the different file types in for this first summary table, but regardless, we can see that Stata is indeed dominant (In fact, we can throw out the .ado files–a Stata format–as they are always coupled with .do files for any journal article in question).
Among the other top languages that show up here, we can see that SAS is still in the top five, and C and Python are both more or less in the top ten. The other file extensions are either below 1%, or come from more niche software packages, so we’ll drop them for the rest of our analysis.
Re-running our table from above with the additional filters, we have:
| file_type | count | share |
|---|---|---|
| do | 2741 | 67.38 |
| m | 947 | 23.28 |
| sas | 174 | 4.28 |
| r | 123 | 3.02 |
| c | 44 | 1.08 |
| py | 39 | 0.96 |
Again, we see that Stata dominates code submissions with a 67.4% share, followed by a very large share for Matlab at 23.3%. And while the data science community has made R and Python their languages of choice, we can see that among economists, they are still a minority. The aggregate figures show that SAS still has an edge over R, and even C has an edge over Python.
How has the use of different analytical software changed over time?
Next we can have have a look to see how the choice of code has evolved over the years:
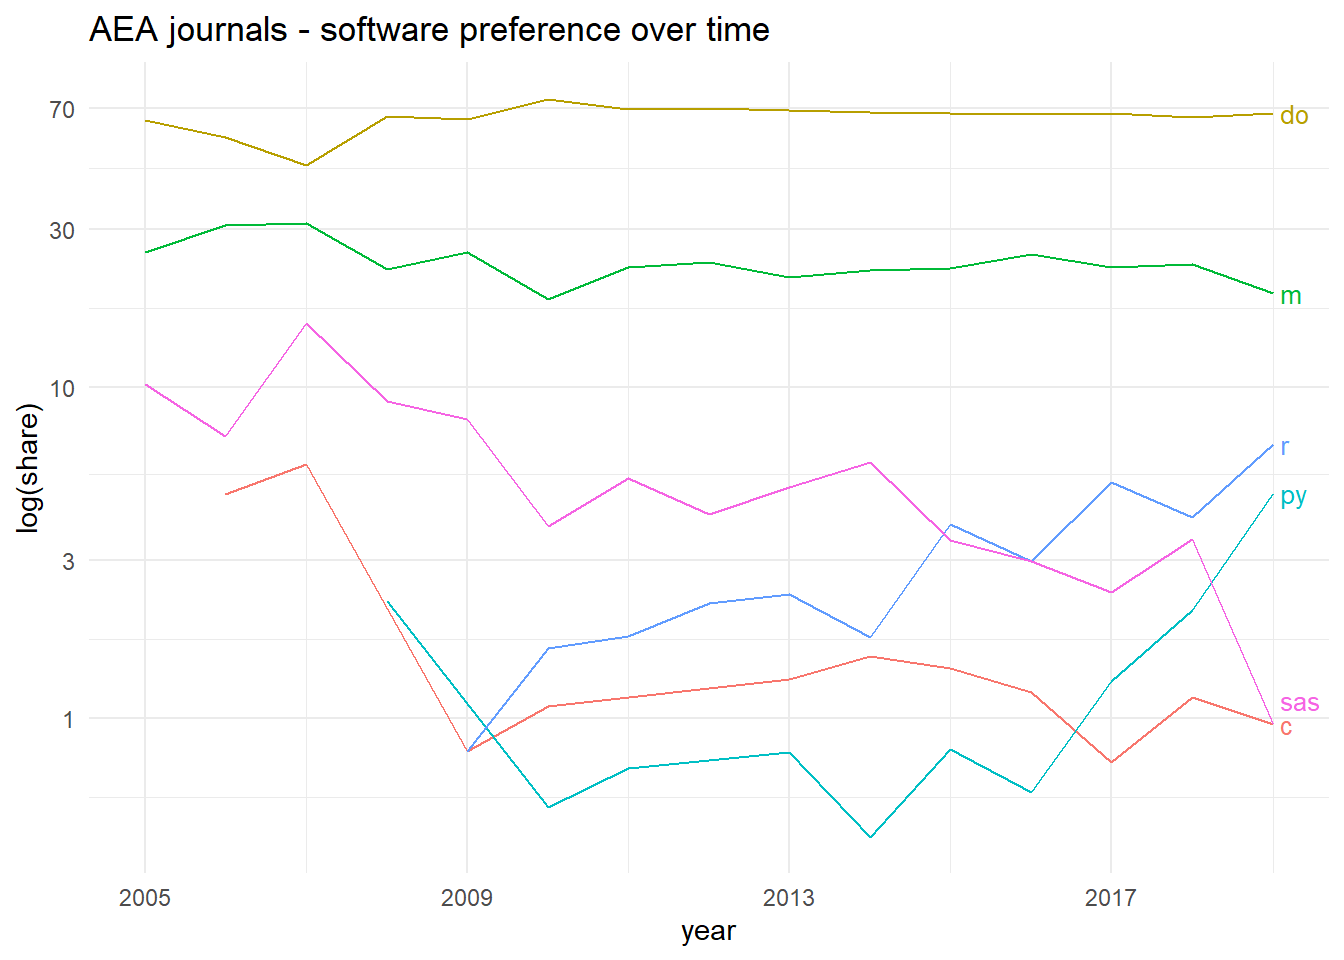
Looking at the use of different packages over time, the picture changes a bit. In this plot we can clearly see Stata’s consistent dominance in the economics field, remaining stable around 70% throughout all years despite the movement of the other software packages. Matlab is the next most popular software package, and its usage is also fairly stable–with maybe a slight tailing off in the past decade.
Among the rest, it’s interesting to see that SAS and C usage has really dropped off over the past 14 years, while conversely, R and Python have had comparable increases in usage. What the aggregate figures from before don’t show is that, by roughly 2015, R has overtaken SAS as the third most popular software package, and that, by 2018, both R and Python are more popular than either SAS or C.
While the plot clearly shows that both R and Python users are still a minority in the Economics field at the moment (6.7% and 4.8% shares in 2019 respectively), I’m curious to see if their upward trend will continue and if they will get closer to Matlab and Stata at any point in the future. For a number of reasons, I suspect that R and Python usage will only continue to increase going forward, though the question of how close they will get to Stata and Matlab I’m less sure of. I can’t imagine that Matlab will be able to maintain its current share going forward, but we’ll see.
Software package tendencies by journal
The last thing I wanted to look at here is the relation between the different journals and coding preferences. In aggregate, we can calculate the shares of our main languages per journal and plot them as follows:
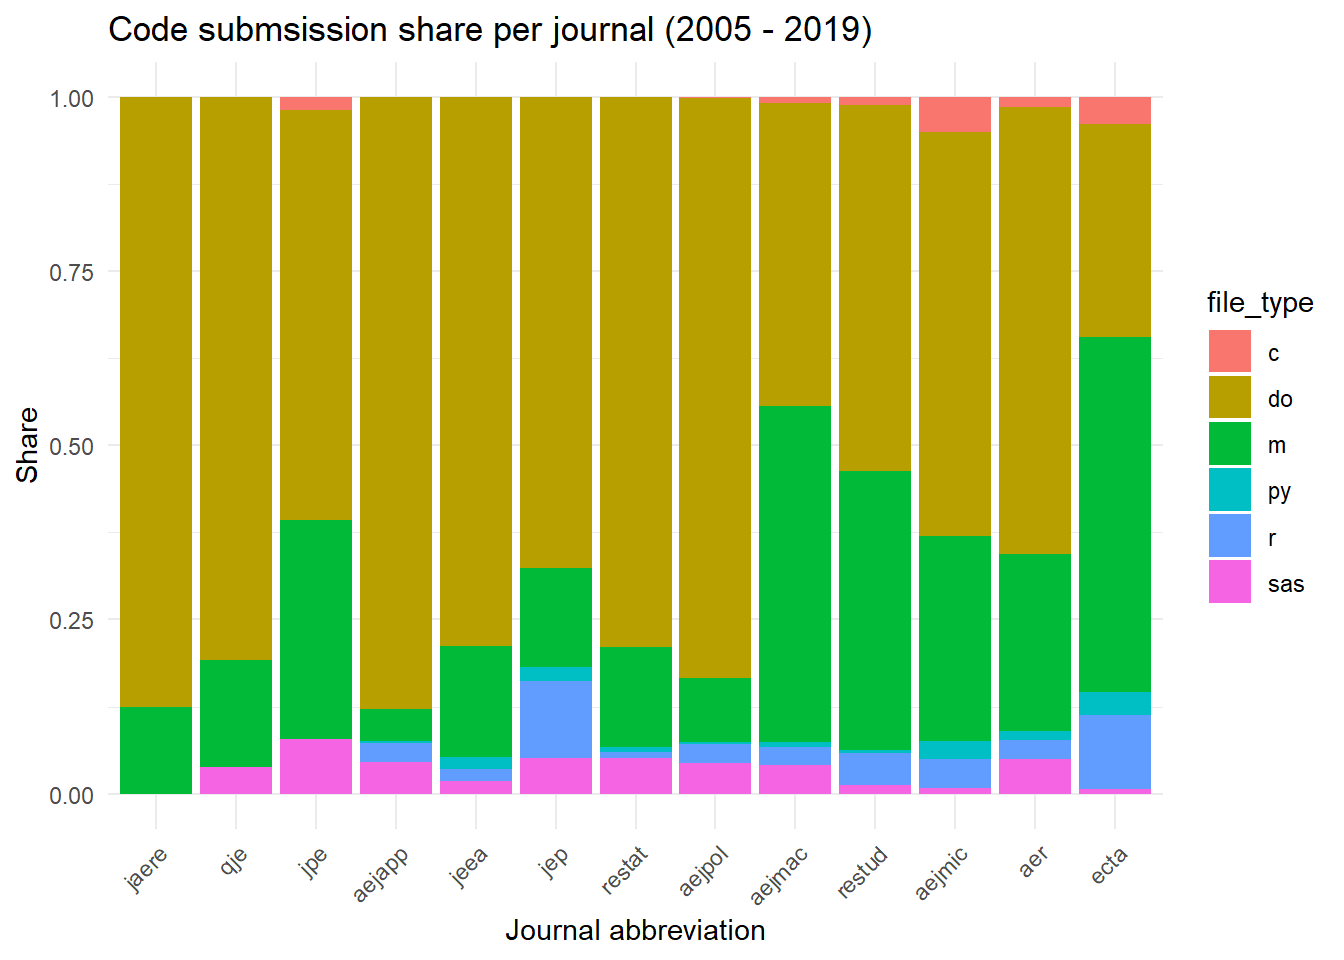
Looking at the plot, a few things stand out to me: first, it appears that the distribution of Stata/Matlab dominance is certainly not even across all journals. The five journals on the right have quite large shares of the Matlab submissions–in particular, Econometrica (51%) and AEJ Macroeconomics (48.2%), where Matlab submissions are actually greater than Stata.
From the R perspective, it’s interesting to note that Econometrica and the Journal of Economic Perspectives both have over 10% of their submissions in R, making them the two leading journals for R users.
Lastly, we can see that the three journals on the left-hand side–Journal of the Association of Environmental and Resource Economists, Quarterly Journal of Economics, and the Journal of Political Economy–are notable in that they do not have any R or Python submissions at all.
And the textual data?
In addition to the information about code and data submitted to the journals, the dataset also includes all of the journal article titles and abstracts, which potentially allows us to derive some insight about the topics covered by the journals. My initial attempts at doing some text analysis didn’t reveal very much, but given how curated the journals are, not finding any interesting patterns in the term and topic frequency patterns here is perhaps not so surprising in retrospect. I’m not sure if there’s any interesting insight buried in here somewhere, but a harder re-think of my approach is definitely required. For the moment, I’ll have to leave that for a part two of this post.